
“Solana Data Is Slow or Incomplete?” What to Check in Your Receiving Infrastructure

You subscribe to a fast Solana Shreds stream, but only a trickle of packets arrives. The Shreds you receive parse correctly, yet too many fragments are missing to extract transactions. gRPC works on the same server, leaving you unsure where to look next.
Alongside checking the sender, look at your application server and the data center hosting it. Even when ERPC forwards Shreds quickly, UDP restrictions along the path or processing bottlenecks on the receiving server can prevent your application from benefiting from that speed.
Choosing a Shreds stream means considering the entire path: how the packets arrive, and how they become usable data. Network quality, distance and data-center operating policies are also shared performance conditions for Geyser Yellowstone gRPC, ordinary RPC and API traffic, and transaction submission.
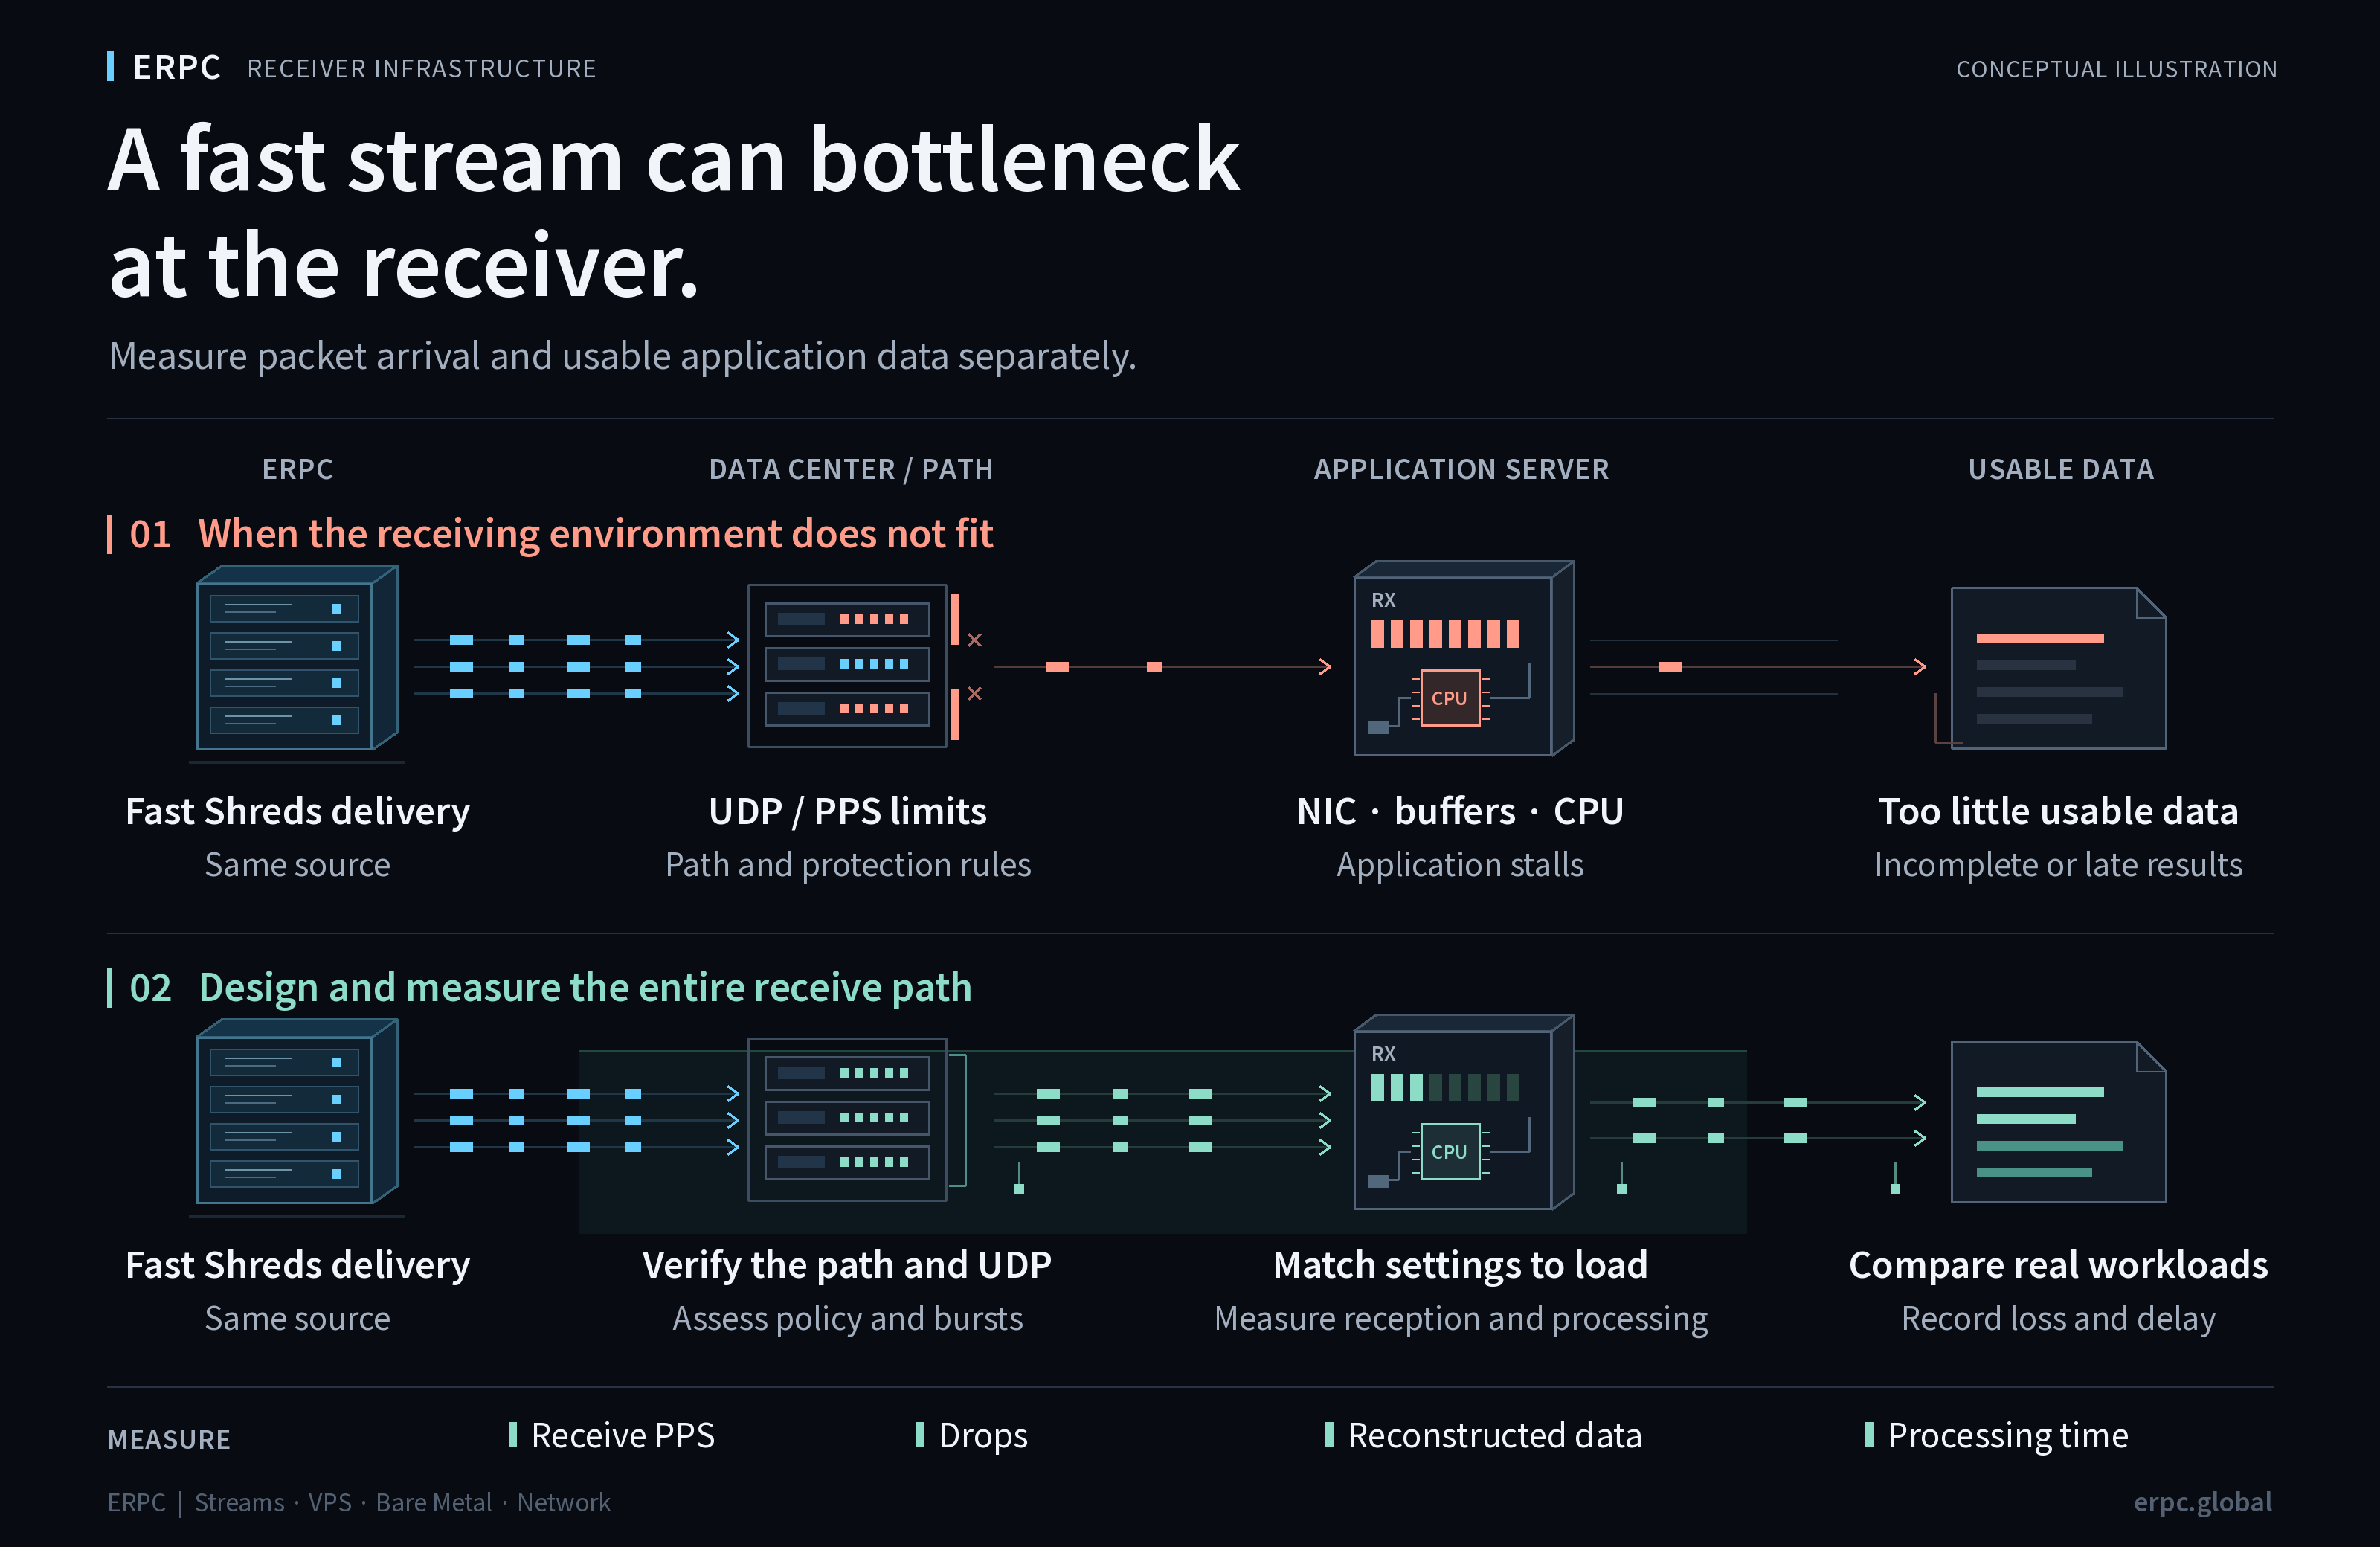
Send-side records and usable received data are different facts
In a recent ERPC support inquiry, short measurements on the sending side recorded approximately 3,400–3,900 packets/sec. The receiver reported approximately 13 packets/sec and no completed slot reconstruction.
These figures come from different measurement periods, and the measurement methods have not been confirmed to be comparable. They therefore do not establish a delivery success rate or a loss rate. Send-side records alone do not prove arrival, and the final cause remains undetermined at the time of writing.
A few thousand PPS also does not, by itself, establish an unusually high load for a general-purpose server. The questions are what happens on the actual path, which limits apply, how traffic is concentrated over short intervals, how reception is handled, and what each counter measures.
Same Frankfurt. Different network paths.
Your stream source and application server can both be in Frankfurt while still occupying separate data centers. In such a configuration, traffic may leave one facility, cross an external network and enter the other. A shared region label does not establish a shared facility, network operator or set of intermediate devices.
For ERPC streams or RPC services and an ERPC VPS or Bare Metal host placed at the same site, the service servers and application server sit in nearby racks, and communication between them stays on the internal network. This is the idea behind ERPC's Zero-Distance Communication: designing physical placement and the path to the receiving application together, beyond choosing the same city.
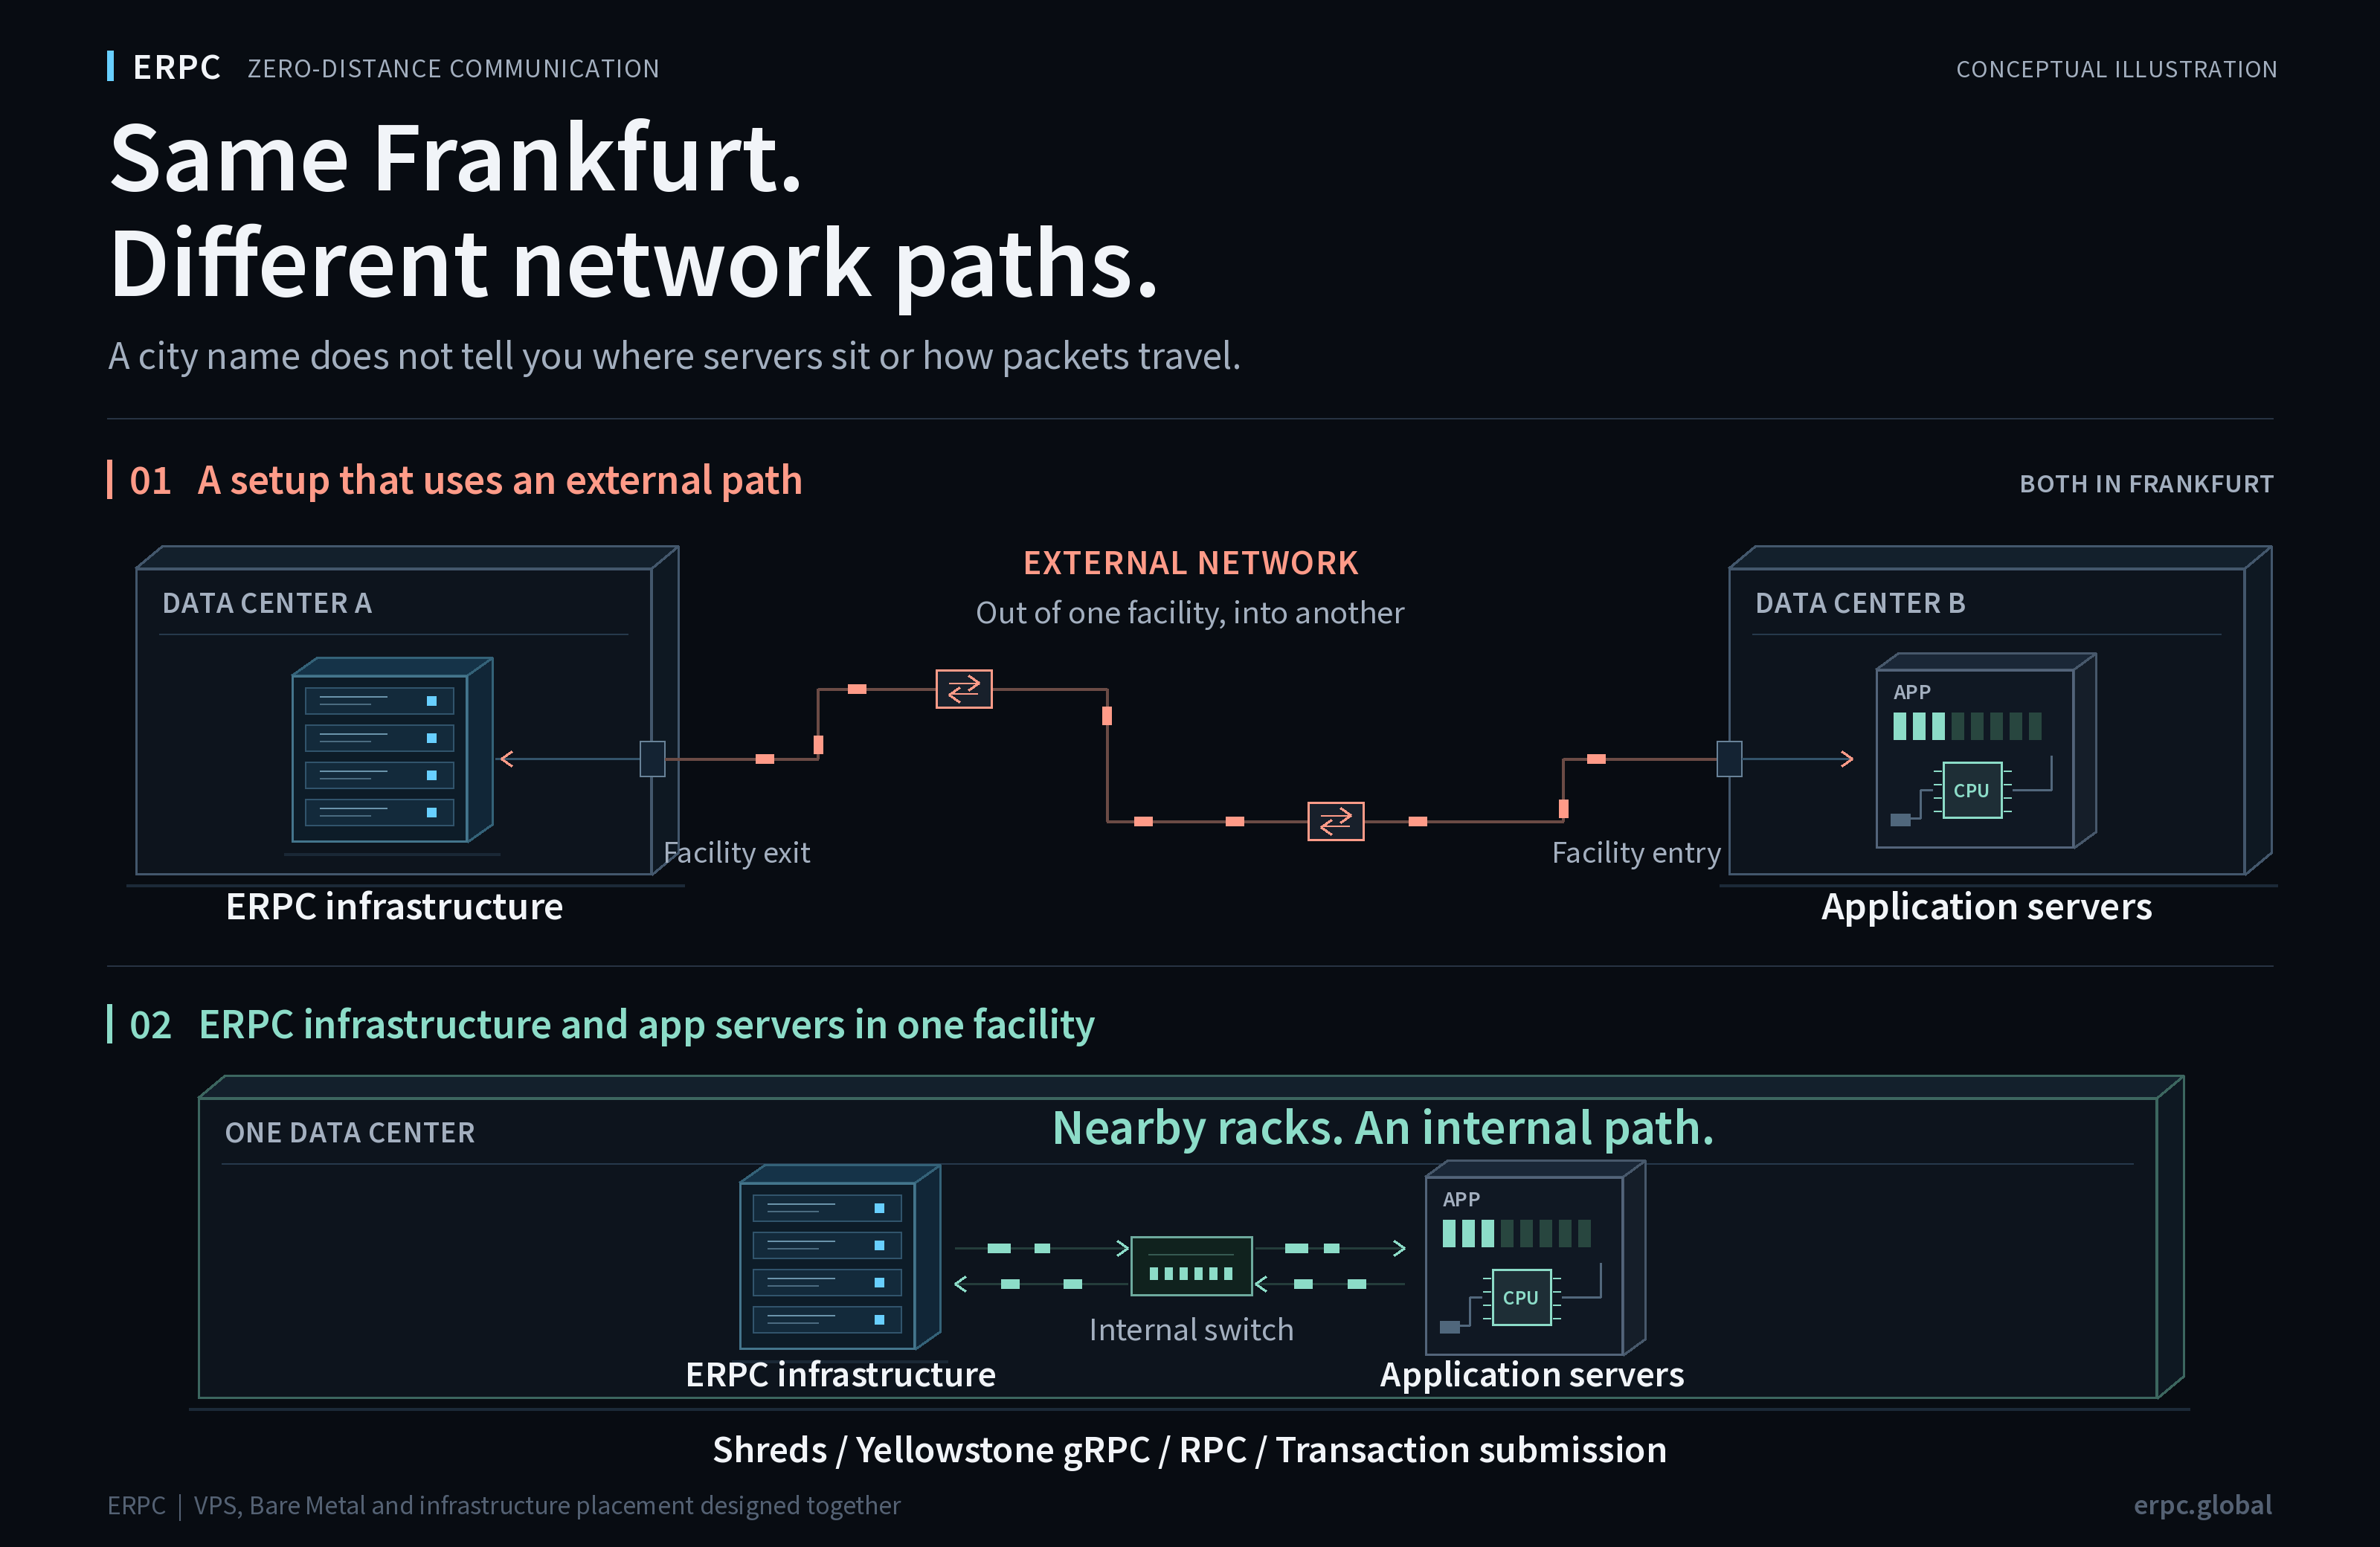
Avoiding an external detour between ERPC services and the application server shortens the path and reduces exposure on that segment to congestion and route changes in external networks. A short path, combined with the resources needed for reception and processing, provides a foundation for benefiting from a fast stream. Verify the result at both packet arrival and application processing.
Network conditions affect every type of communication
Missing fragments make the problem visible with Shreds, but the quality of the same infrastructure affects data reception, API requests and transaction submission more broadly. The protocol changes the symptoms an application sees and the points worth measuring.
| Communication | Where network effects appear | What to check in the application |
|---|---|---|
| Shreds / UDP | Packet loss and delay, and arrival of fragments needed for reconstruction | Valid Shreds and time until data can be reconstructed |
| Geyser Yellowstone gRPC | TCP retransmission waits, stream backlog and delay | Time until the same update is received and processed |
| RPC, APIs and service-to-service traffic | Request and response round trips, and waits during congestion | Response time and its variation |
| Transaction submission | The request path to the receiving node | Time from the submission request to the node's response |
Close placement and appropriate operating policies support all of this traffic. Measure the receiving node's response time separately from the time until a transaction is included and finalized on-chain.
Gbps does not tell you everything about PPS and bursts
Bandwidth describes how much data can be carried over time. PPS describes the number of packets processed each second. A connection can have spare bandwidth while hitting a packet-rate limit or a restriction applied to UDP. Cloud providers' own documentation treats bandwidth and PPS allowances as separate constraints.[1]
Shreds do not necessarily arrive at an even rate. A burst can create queue pressure that an average conceals. If packets accumulate faster than a network device or receiver can process them, packets beyond the queue's capacity may be dropped.[2]
Ask your hosting provider about sustained UDP reception, short bursts, PPS limits and the rules applied by DDoS protection. The goal is to establish conditions that safely admit the required traffic, rather than disabling protection indiscriminately.
Working gRPC does not establish working UDP reception
TCP-based gRPC and raw Shreds over UDP use different transport mechanisms. TCP provides retransmission and ordering, while streaming gRPC has flow control that accounts for receiver capacity. UDP itself does not retransmit missing packets or make the sender wait for the receiving application to catch up.[3]
Consequently, working gRPC on a server does not prove that the UDP path or receiver is working correctly. Protocol-specific filters, ports, delivery paths and receiver implementations need separate checks. gRPC processing delays can also surface as waiting time or disconnections.
Transactions/sec on gRPC and packets/sec on UDP measure different units at different processing stages. They cannot be compared directly to calculate delivery volume or a loss rate.
From arriving packets to usable data
With a standard UDP socket receiver, arriving packets pass through the NIC, kernel and socket receive buffer before reaching the application. If processing falls behind, they can be dropped after reaching the host. Linux interface receive counters include packets dropped at later stages, so a rising receive count alone does not establish application delivery.[4]
An individual receive queue or CPU core can become busy even when overall CPU utilization is low. Check NIC queues, interrupt placement and single-core performance. In the application, separate reception from downstream work where appropriate, keeping expensive parsing and excessive logging out of the receive loop. A larger receive buffer can absorb temporary bursts; it cannot resolve a sustained processing-capacity deficit.[5]
Shreds are fragments of block data. Forward error correction (FEC) can recover missing data using data and coding shreds from the same group, but reconstruction still requires enough fragments. More duplicate packets do not substitute for missing fragments.[6]
Depending on the implementation, a receiver can reconstruct entries from available fragments before the entire slot is complete.[9] Alongside total packet counts, measure valid unique Shreds, reconstructed data, and the time until the application recognizes the event it needs.
Measure each stage over the same time window
Align the destination, port and measurement window on both sides. Recording the following stages separately helps narrow the next investigation.
| Measurement point | What to record | What it establishes |
|---|---|---|
| Sender | Records for the target destination and the counter's definition | Which sending stage was observed |
| Receiving host's entry point | Capture of the target UDP traffic, NIC statistics and capture drops | How much traffic was visible at that observation point |
| OS and socket | UDP errors, receive-buffer drops and queue changes | Whether reception is backing up inside the host |
| Shreds reconstruction | Valid unique Shreds, successful reconstruction, missing data and errors | Whether packets yield the required data |
| Application | Processing backlog and detection timestamps for the same event | Whether arrival speed reaches the application |
If a capture shows few packets, first check its filter, the observed interface, capture losses and NIC drops. Some OS counters cover the whole host or network namespace; check their scope and relate them to measurements from the target application.[4][5]
Change settings after identifying the constrained stage. Increasing a buffer or ring alone can move the bottleneck or add waiting time. Current ERPC receiver configuration and checks are documented here:
Choose the operating policy as well as the server
The Solana Foundation explains the importance of control over NICs, physical cores, drivers and networking for high-performance validators. Those full-validator requirements should not be applied wholesale to every Shreds receiver. A receiving application needs a configuration suited to its own stream and processing workload.[7]
Reducing cost or power consumption is a reasonable operating goal. HFT and real-time applications also need prompt CPU response, sustained processing capacity and short network waits. Waking from a power-saving state can involve a latency tradeoff.[8]
Alongside CPU models and core counts, check how resources are shared, how sustained load is handled, the conditions for UDP traffic, and the actual network path.
ERPC considers the stream and the receiving environment together
ERPC works on data-center selection close to Solana infrastructure, network paths, hardware and operating settings, providing VPS and Bare Metal alongside Shreds and gRPC. You can select a VPS for your processing workload and compare Bare Metal when you want exclusive physical resources.
Understanding the configuration and operation of the environments we provide also supports technical troubleshooting. We can compare send-side records with receiver measurements and identify concrete checks for the network, OS or application. In the inquiry described here, we checked the send-side measurements and requested additional measurements from the receiver.
Evaluating the stream, receiver placement and application implementation together makes it easier to identify what is missing between the service you selected and the data you need.
Compare your current environment using hourly billing
If you are unsure about your receiving environment, try an ERPC VPS or Bare Metal server with hourly billing and compare the same stream and application. Check the dashboard for current pricing, availability and ordering conditions in your preferred region.
Start with an available configuration and record reception counts, reconstructed data, processing backlog and detection timestamps for the same events. When comparing timestamps across hosts, check clock synchronization accuracy too. Repeat the test at different times and compare where in the path the results differ. Use those measurements to choose a server and data center suited to your application.
- VPS: https://erpc.global/en/vps/
- Bare Metal: https://erpc.global/en/baremetal/
- Dashboard: https://dashboard.erpc.global/en/
Related articles
- Solana Stream SDK v4.0.0: https://erpc.global/en/news/2026/11/07/erpc-solana-stream-sdk-v4-20261107/
- [9] Shreds UDP Forwarding Premium: https://erpc.global/en/news/2026/11/03/erpc-shreds-udp-forwarding-premium-20261103/
- Validators DAO official Discord: https://discord.gg/C7ZQSrCkYR
Technical references
- [1] AWS EC2 bandwidth and PPS allowances: https://docs.aws.amazon.com/AWSEC2/latest/UserGuide/monitoring-network-performance-ena.html
- [2] IETF UDP Usage Guidelines, bursts: https://www.rfc-editor.org/rfc/rfc8085.html#section-3.1.6
- [3] Linux UDP: https://man7.org/linux/man-pages/man7/udp.7.html
- [3] Linux TCP: https://man7.org/linux/man-pages/man7/tcp.7.html
- [3] gRPC Flow Control: https://grpc.io/docs/guides/flow-control/
- [4] Linux Interface statistics: https://docs.kernel.org/networking/statistics.html
- [4] libpcap capture behavior and drops: https://github.com/the-tcpdump-group/libpcap/blob/master/doc/README.linux
- [5] Scaling in the Linux Networking Stack: https://docs.kernel.org/networking/scaling.html
- [5] Linux socket receive buffers: https://man7.org/linux/man-pages/man7/socket.7.html
- [5] Red Hat UDP drop investigation: https://docs.redhat.com/en/documentation/red_hat_enterprise_linux/10/html/network_troubleshooting_and_performance_tuning/tuning-udp-connections
- [6] Anza Turbine Block Propagation: https://docs.anza.xyz/consensus/turbine-block-propagation/
- [7] Solana Foundation, high-performance validator hardware: https://solana.com/news/high-performance-solana-validators-run-on-bare-metal-hardware
- [8] Linux CPU Idle Time Management: https://docs.kernel.org/admin-guide/pm/cpuidle.html