
Validators Solutions Launches Solana Block Analyzer — Visualizing Per-Slot Block Production Time and Assigned Validators
ELSOUL LABO B.V. (Headquarters: Amsterdam, the Netherlands; CEO: Fumitake Kawasaki) and Validators DAO are pleased to announce the launch of the Solana Block Analyzer (Slot Duration) on Validators Solutions, the Solana On-chain Intelligence & Network Analytics site. The new view visualizes the rhythm of Solana block production at the slot level.
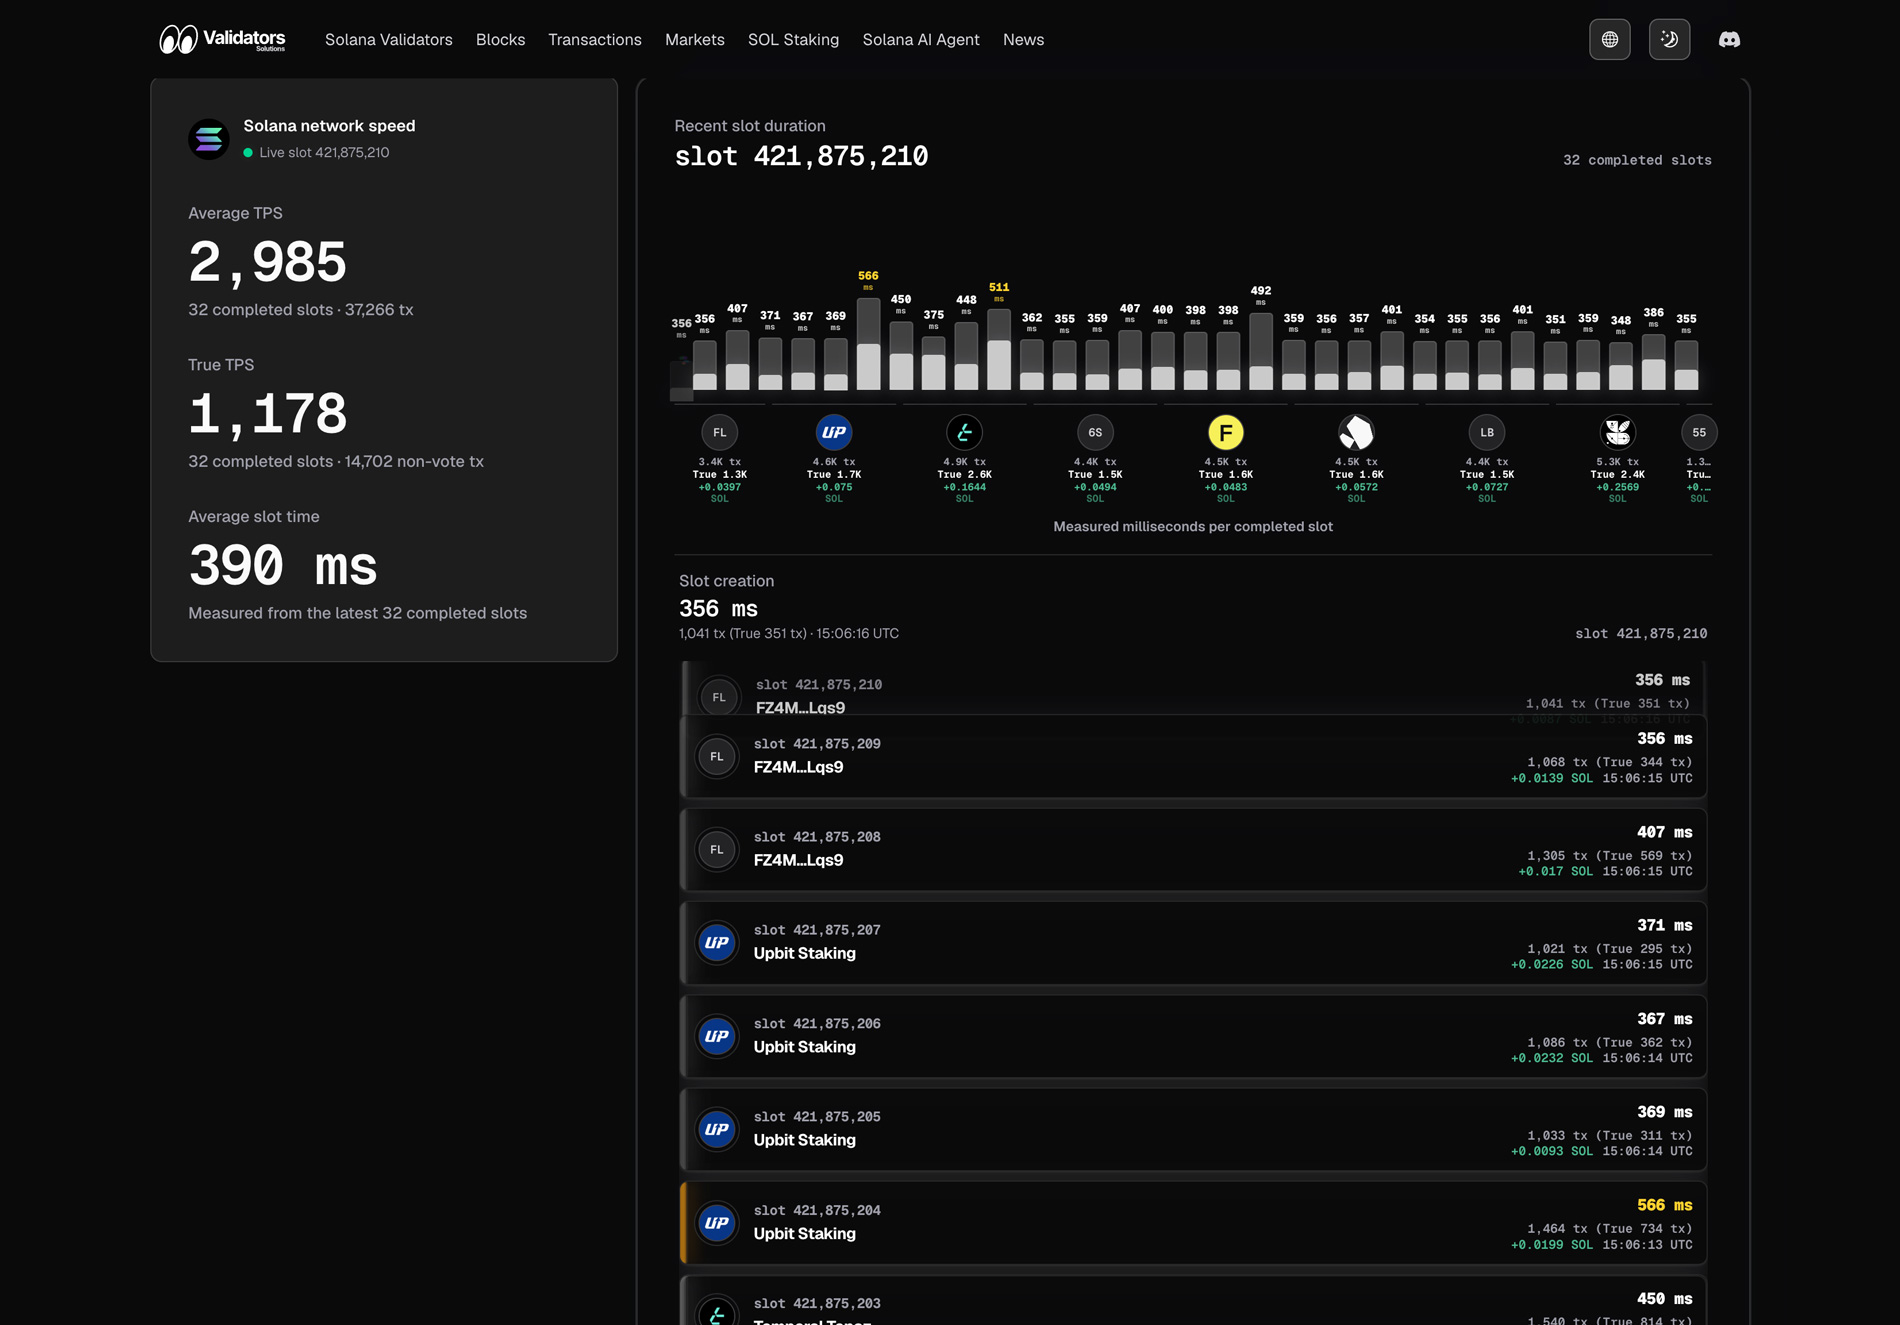
The Solana Block Analyzer covers the most recent 32 slots on Solana mainnet. It displays both network-wide indicators — average TPS, True TPS (transactions-per-second based on transactions excluding vote transactions), and average slot time — and per-slot details: block production time, assigned validator, transaction count, True transaction count, and block reward — presented as a bar chart together with a detailed slot list. Beyond averaged figures, users can see the per-slot reality and distribution of how Solana block production is unfolding across the network.
Solana Block Analyzer: https://validators.solutions/en/validators/reports/slot-duration/
Solana's "400 ms target" and the real per-slot distribution
Solana slots are designed around a target of roughly 400 ms. Many teams building trading applications, bots, and real-time systems on Solana have used 400 ms as a reference point when designing application logic and strategies.
In practice, however, block production time on Solana mainnet varies from slot to slot, and from one assigned validator to another. Some slots complete in well under 400 ms, while others take 500 ms or more — occasionally close to 600 ms. Behind the average, the per-slot distribution shifts dynamically. That distribution is the real face of the live Solana network.
The Solana Block Analyzer was designed as a view that makes this "other side of the average" directly visible. It lines up the most recent 32 slots as a bar chart, shows each slot's block production time in milliseconds, and highlights slots that took relatively longer with a distinct color. By seeing the distribution as well as the average, users can understand the actual rhythm of the Solana network their applications run on.
Per-slot block production time and assigned validator in a single view
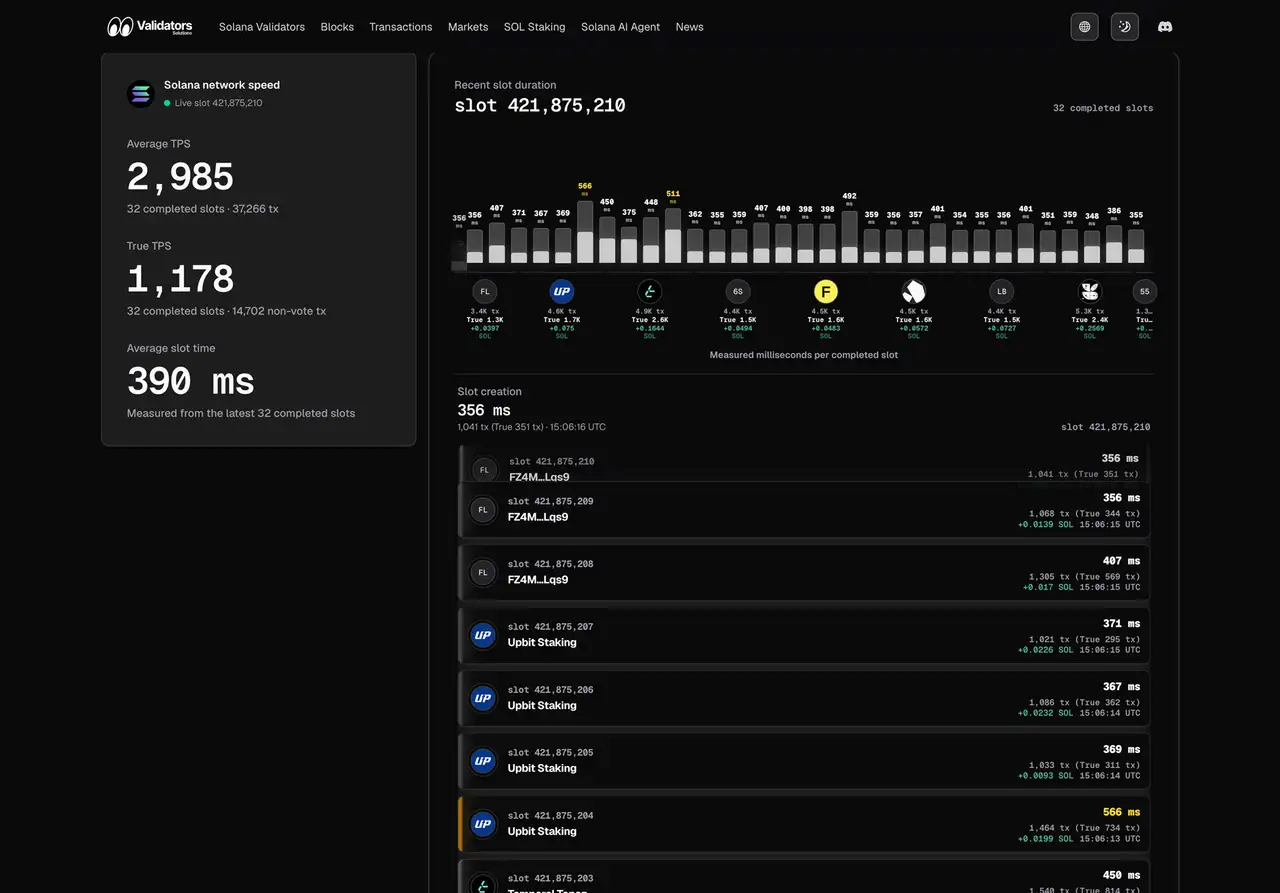
At the top of the Solana Block Analyzer, a "Solana network speed" panel displays the average TPS, True TPS, and average slot time across the most recent 32 slots. In the center, "Recent slot duration" presents per-slot block production time as a bar chart, with the assigned validator, transaction count, True transaction count, and block reward shown directly under each bar.
Each bar is labeled with the assigned validator's identity marker, transaction count, True transaction count, and block reward in SOL. Stretches where the same validator produces consecutive slots, and the exact moment leadership switches to another validator, are all visually traceable.
Below the chart, a slot list shows — in reverse chronological order — the assigned validator name, the validator address, the slot number, the block production time in milliseconds, the transaction count (and True transaction count), the block reward in SOL, and the UTC timestamp. Users can grasp the overall picture with the chart and then check individual slot details in the list, observing Solana block production in two complementary layers.
Fast slots and slow slots, lined up neutrally on the same screen
Not every validator on Solana mainnet produces blocks at the same pace. Some validators consistently produce blocks in a short amount of time. Others take relatively longer to produce blocks. Even the same validator may vary in block production time from slot to slot, depending on network conditions and the assigned slot range.
The Solana Block Analyzer visualizes this difference in a neutral way. Both quickly completed slots and slots that took longer are shown side by side on the same screen. Users can see for themselves, as straightforward facts, which validators are producing blocks at which speeds.
In slots whose production time turns out to be relatively longer, more transactions can end up being included, and reward components such as priority fees and Jito Bundle tips may become larger as a result. At the same time, when a slot's production stretches out, it can affect the network-wide average slot pace and the progress of subsequent slots. Between a single slot's processing volume and the overall responsiveness of the network, this kind of trade-off exists.
By surfacing this trade-off in an observable form, the Solana Block Analyzer gives stakers, validator operators, and developers the information they need to observe and judge how block production is unfolding across the network as a whole.
Information that directly informs trading apps, bots, monitoring, and analytics
For teams building trading applications, bots, liquidation logic, on-chain event detection, monitoring systems, analytics platforms, and real-time data delivery on Solana, "actual per-slot block production time" is information that directly affects design quality.
Timeout strategies built on a 400 ms assumption, transaction resend logic, behavior around leader transitions, buffer sizing for Geyser gRPC and Shredstream, SWQoS strategy, fee configuration, and slippage tolerance all need to be designed against the real rhythm of block production — not just an assumed average.
By visualizing the per-slot distribution that simple averages cannot reveal, the Solana Block Analyzer provides the premise needed for these design decisions. Application and infrastructure design can be built on top of the block production rhythm actually unfolding on mainnet, rather than on theoretical values alone.
True TPS and block reward — real demand at both the network and slot level
The Solana Block Analyzer shows aggregated average TPS and True TPS (transactions-per-second based on transactions excluding vote transactions) for the most recent 32 slots at the top of the screen, and per-slot total transaction count, True transaction count (transaction count excluding vote transactions), and block reward in SOL at the bottom. This lets users see, on the same screen, network-wide throughput together with how much real demand each slot is carrying and how much economic value moved through it.
True TPS is an important metric for understanding actual application usage on Solana. Total TPS includes a large number of vote transactions that support consensus; to measure real application activity, the vote portion must be excluded. True TPS provides that view directly.
The block reward reflects the aggregation of priority fees, Jito Bundle tips, and other economic activity contained in the slot. Looking at per-slot True transaction count and block reward together gives an intuitive sense of how Solana network demand and economic activity are distributed across slots.
Combining with other Validators Solutions views to understand Solana as a whole
The Solana Block Analyzer becomes even more useful when combined with the other visualizations on Validators Solutions, allowing users to grasp the Solana network from multiple angles.
The globe animation visualizes Solana's leader schedule and the global flow of block production across geography. Validator distribution, stake distribution, and network reports show how validators are spread across countries and cities, how stake is concentrated, and what level of decentralization the network maintains through metrics such as the Nakamoto coefficient and the Lorenz curve.
The Solana Block Analyzer adds the time axis — the rhythm of slot production over time. Across geographic distribution, stake distribution, and the leader schedule, users can now observe actual per-slot block production as a distribution rather than only as an average. Solana becomes understandable through three combined axes: where, by which validator, and at what cadence blocks are produced.
Following Solana's coming acceleration with the same visualization
Solana is set to see major improvements in network-wide responsiveness — including finality, confirmation latency, and time-to-inclusion — through next-generation consensus protocol improvements such as Alpenglow, faster validator clients, and improvements to data propagation and execution infrastructure. As this acceleration progresses, the 400 ms slot time that has long served as a reference point, the actual rhythm of block production, and the application-side assumptions around wait times, retry design, and real-time detection will all begin to shift.
The Solana Block Analyzer will follow this acceleration with the same view. It will continue to visualize not only the current per-slot block production time and distribution, but also the assigned validator, True transaction count, block reward, and per-slot rhythm as Solana evolves through Alpenglow and other protocol improvements.
Users will be able to see, in real time on Validators Solutions, how fast Solana is producing blocks right now and how the network's overall responsiveness is changing.
Making blockchain transparency easier to see
Blockchains are by design open networks whose state is verifiable by anyone. In practice, however, understanding that state requires holding multiple concepts simultaneously — slots, block production time, leader schedule, validator distribution, stake concentration, transactions — and grasping the current situation without tooling is not straightforward.
Validators Solutions aims to make this state easier to see. The Solana Block Analyzer is part of that effort: a view that brings the per-slot reality behind the averages into a form that anyone can intuitively confirm.
For stakers, it serves as a starting point for checking how the validators they delegate to actually produce blocks. For validator operators, it provides information about their own block production within the context of the whole network. For developers building trading apps, bots, monitoring systems, analytics, and real-time systems on Solana, it surfaces the block production rhythm that should serve as the premise of their designs — not only as an average, but as a distribution.
Validators Solutions will continue to make the Solana network more transparent and easier to understand. The Solana Block Analyzer is one step in that direction.
ELSOUL LABO's R&D and Solana information infrastructure
ELSOUL LABO has been approved under WBSO, the research and development support program of the Government of the Netherlands, for five consecutive years since 2022. Our continuing R&D covers Solana RPC infrastructure, validator operations, real-time data delivery, historical data retrieval, AI agent–assisted operations and development, and visualization of Solana network information. These results are reflected across ERPC, SLV, SLV AI, Validators Solutions, and the AS200261 Solana-specialized data center, among other services.
The Solana Block Analyzer joins Validators Solutions, ERPC, and SLV as part of the information infrastructure for visually understanding the real state of the Solana network. We will continue to improve it.
Contact
For inquiries regarding the Solana Block Analyzer, Validators Solutions, SOL Staking, SLV AI, or ERPC, please open a support ticket on the official Validators DAO Discord.
Solana Block Analyzer: https://validators.solutions/en/validators/reports/slot-duration/
Validators Solutions: https://validators.solutions/en/
Validators DAO Official Discord: https://discord.gg/C7ZQSrCkYR